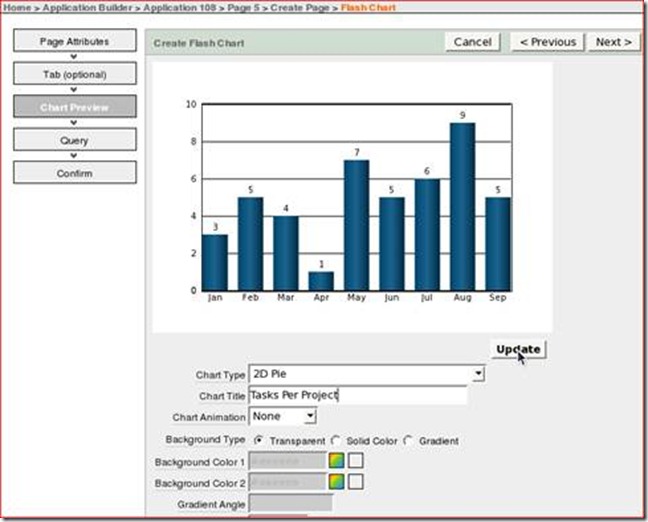
You want to create a flash chart. You need to create a 2D pie chart that shows the number of tasks per project. Perform the following steps:
| 1. | Click Create Page > in the Project Tasks Application home page. |
| 2. | Select the Chart Page Type and click Next >. |
| 3. | Select the Flash Chart radio button and click Next >. |
| 4. | Enter the page name as Tasks per Project Chart, accept the other default values, and click Next >. |
| 5. | Select the Do not use tabs option and click Next >. |
| 6. | Select 2D Pie as the Chart Type, enter Tasks per Project as the Chart Title and click the Update button to refresh the chart preview. |
| 7. | The preview of the Tasks per Project flash chart is displayed. Click Next >. |
| 8. | Enter the following query into the query field. Click Next >.
select null link, p.project label, t.task_count value from (select project_id, count(*) task_count from apex_tasks group by project_id) t, apex_project_lookup p where t.project_id = p.project_id
|
| 9. | Click Finish to create the chart. |
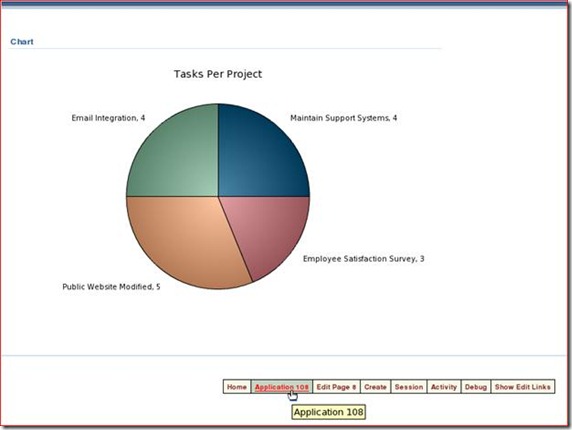
| 10. | The flash chart has been created. Click the Run Page icon to view the flash chart. |
| 11. | The flash chart shows the number of tasks per project. The first number for each slice of pie is the project and the second number is the number of tasks. Click the Application <n> link in the developer tool bar. |


No comments:
Post a Comment